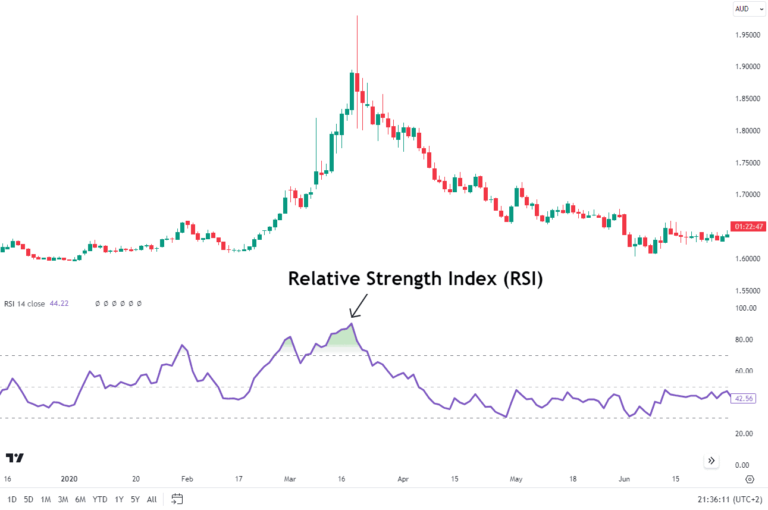
The Relative Strength Index (RSI) is one of the most widely used momentum indicators in technical analysis, helping traders identify buy and sell signals, gauge market strength, and anticipate potential reversals.
Understanding what RSI means in the stock market, how to interpret a falling RSI, and the significance of the RSI level, especially the key 50 mark, can greatly enhance trading and investing decisions. When RSI rises above 70, a stock may be overbought, while dips below 30 often suggest oversold conditions. Learning how to read and use the RSI indicator, in conjunction with tools like Williams %R (14), gives traders a more comprehensive view of market momentum and timing. This guide breaks down each component of the RSI, from the role of 50 to real-world strategies that leverage this indicator for more informed trading.

Table of Contents
ToggleRelative Strength Index (RSI) indicator buy and sell signals
The Relative Strength Index (RSI) is a tool traders use to judge when a market might be “due” for a reversal in price. Think of it like a speedometer for price moves: it tells you how fast and how far prices have been changing recently, on a scale of 0 to 100.
1. What Relative Strength Index (RSI) Means
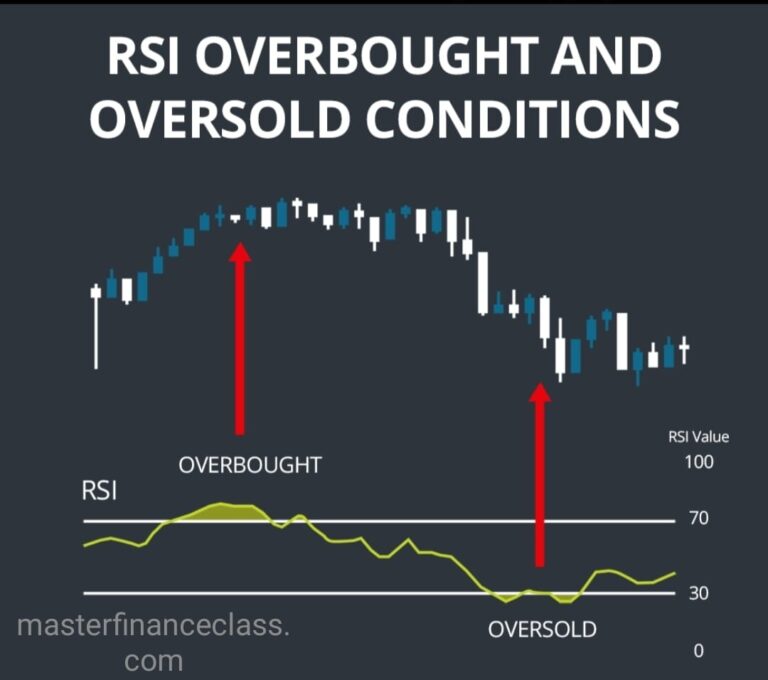
High RSI (above 70): Prices have been rising hard and fast. The market may be “overbought,” meaning buyers have pushed it up so quickly that a pullback (or little breather) is likely.
Low RSI (below 30): Prices have been falling hard and fast. The market may be “oversold,” meaning sellers have pushed it down so much that a bounce is likely.
When RSI sits in the middle (around 50), it means there’s no strong momentum one way or the other.
2. Simple Buy & Sell “Cross” Signals
- Buy Signal
- RSI drops below 30 (oversold)
- Then RSI climbs back above 30
- That rebound suggests selling pressure has eased, so it might be a good time to buy.
- Sell Signal
- RSI rises above 70 (overbought)
- Then RSI falls back below 70
- That slip suggests buying pressure is drying up, so it might be time to take profits or sell.
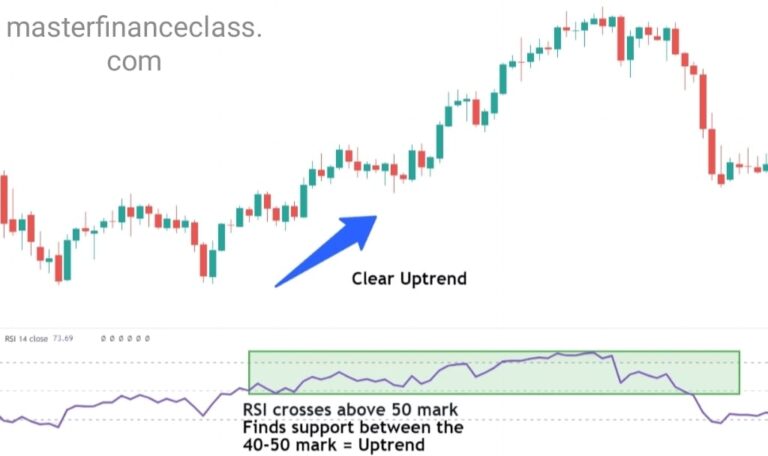
3. Spotting Momentum Shifts (50 Line Cross)
- Bullish Momentum:
RSI moves up through 50. Think of it as shifting from “sluggish” to “gaining steam” a mild green light for buyers.
- Bearish Momentum:
RSI moves down through 50. That shift suggests the market is losing steam, an early warning for sellers.
4. Catching Hidden Clues: Divergences
Sometimes price and Relative Strength Index (RSI) tell different stories:
Bullish Divergence
- Price makes a lower low (e.g. drops from ₹100 → ₹95 → ₹90)
- RSI makes a higher low (e.g. dips to 25 → then only to 28)
- It hints that selling pressure is weakening, even though price is still falling a potential buying opportunity.
Bearish Divergence
- Price makes a higher high (e.g. ₹100 → ₹105 → ₹110)
- RSI makes a lower high (e.g., rises to 75 → then only to 72)
- Sellers may be stepping back in, even as price climbs watch for a possible sell‑off.
5. “Failure Swings” for Extra Confidence
These are Relative Strength Index (RSI)‑only setups that can give cleaner signals:
Bullish Failure Swing
- RSI dips below 30, then back above 30.
- RSI pulls back a bit, but stays above 30.
- RSI then breaks above its most recent peak.
- That final break often lines up nicely with a rally in price.
Bearish Failure Swing
- RSI jumps above 70, then falls back below 70.
- RSI rallies again but stays below 70.
- RSI then breaks below its recent low.
4.This can herald a sharper dip in price.
6. Tweaking Relative Strength Index (RSI) to Fit Your Style
Shorter look‑back (like 7 days): RSI reacts faster more signals, but more “noise.”
Longer look‑back (like 21 days): RSI is smoother fewer signals, but generally more reliable.
Adjust thresholds: If a market is very strong, you might use 80/20 instead of 70/30 to avoid premature signals.
7. Putting It All Together
1. Check the Trend First. Only take “buy” RSI signals in an uptrend; only take “sell” signals in a downtrend.
2. Watch Price Action. Combine RSI signals with candlestick patterns or support/resistance lines for extra confirmation.
3. Manage Risk. Always use a stop‑loss (e.g., just below a recent swing low if buying) so one false signal doesn’t wipe you out.
Relative Strength Index (RSI) Quick Reference Cheat‑Sheet
Signal | What You See | What It Means |
RSI crosses above 30 | Comes up from below 30 | Potential buy cue |
RSI crosses below 70 | Drops from above 70 | Potential sell cue |
RSI crosses above 50 | Moves up through the midpoint | Bullish momentum |
RSI crosses below 50 | Moves down through the midpoint | Bearish momentum |
Bullish divergence | Price ↓↓, RSI ↑↑ | Selling pressure easing buyer |
Bearish divergence | Price ↑↑, RSI ↓↓ | Buying pressure easing seller |
Failure swing | RSI pattern away from 30/70, then breaks high/low | Strong momentum shift |
By viewing Relative Strength Index (RSI) as a “speedometer” for price moves overly fast up or down you can better spot when the market might need to slow down or reverse. Combine its simple threshold crosses, divergences, and failure swings with your broader trading plan, and you’ll have a clearer picture of when to enter or exit.
Relative Strength Index (RSI) Williamson%R(14)
It is a momentum indicator which indicates the current closing price of the stock in relation to its high & low of the past 14 days. Its purpose is to tell whether a stock is trading near the high or the low, or somewhere in between of its recent trading range. Readings between 0 and -20 imply an overbought condition, readings between -20 to -50 implies bulish condition, readings between -50 to -80 implies bearish condition and readings between -80 to -100 imply oversold position.
Relative Strength Index (RSI) Role of 50
Above 50 = Bullish lean:
When the Relative Strength Index (RSI) moves up through 50, it’s like the market shifts gears from “meh” to “gaining steam” on the upside. Buyers are generally in control, and you’ll often see prices making higher highs and higher lows. Traders often look to take only buy signals (like pullbacks into support) when RSI is above this midpoint.
Below 50 = Bearish lean:
When the Relative Strength Index (RSI) drops down through 50, momentum tilts in favor of sellers. Prices tend to make lower lows and lower highs. In this zone, most will only consider selling or shorting on rallies, since the overall “wind” is at the bears’ backs.
Why 50 matters:
Early trend filter: It helps you spot the start of a new trend before extreme overbought/oversold levels kick in.
Signal confirmation:
A bounce off 50 toward 70 adds confidence to a buy, while a retreat from 50 toward 30 bolsters a sell setup.
Noise reduction: Rather than waiting for Relative Strength Index (RSI) to hit the more extreme 70/30, the 50 line gives you a simpler, earlier indication of which side (bulls or bears) is winning tug‑of‑war.
Real‑World Example
- Uptrend scenario:
- Price is climbing, RSI hovers above 50.
- RSI dips down toward 50 (say from 60 to 52), then turns back up through 55.
- That move signals “the bulls are back in charge” a common spot to buy a pullback.
- Downtrend scenario:
- Price is falling, RSI stays below 50.
- RSI spikes up to 48 on a brief rally, then turns back below 45.
- That drop tells you the sellers have regained control an area to consider adding or entering a short.
Falling Relative Strength Index (RSI) meaning
When you see the RSI falling, it simply means that selling pressure is starting to outpace buying pressure momentum is slowing or shifting to the downside so the market is losing its upward drive and could be gearing up for a pullback or downtrend if the drop continues.
What is Relative Strength Index (RSI) in stock market
The Relative Strength Index, or RSI, is a simple gauge traders use to see how “hot” or “cold” a stock’s recent price action has been. Imagine it as a thermometer measuring buying versus selling pressure over a set period (usually 14 days):
Scale of 0–100:
- Readings near 100 mean the stock’s been running up quickly (lots of buying).
- Readings near 0 mean it’s been dropping fast (lots of selling).
- Around 50 means things are balanced no clear momentum.
Why it matters:
- If RSI goes above 70, the stock may be “overbought” buyers have pushed it up so much it might pause or pull back.
- If RSI dips below 30, it may be “oversold” sellers have pushed it down so far it could bounce.
How it’s calculated:
- Look at your chosen window (e.g., the last 14 days).
- Add up how many points the stock rose on “up” days, and average that.
- Add up how many points it fell on “down” days, and average that.
- Compare those averages to see which side (up or down) has been stronger, then convert that comparison into a 0–100 reading.
How traders use it:
- Entry/exit clues: Buy when it climbs back above 30 (after dipping), sell when it falls back below 70 (after rising).
- Trend filter: If RSI is mostly above 50, the trend’s up favor buy signals. If it’s mostly below 50, the trend’s down favor sell signals.
- Divergences: Sometimes price makes a new high but RSI doesn’t (or price makes a new low but RSI doesn’t) that mismatch can warn of a coming reversal.
Think of Relative Strength Index (RSI) as a quick check of whether a stock’s recent moves are getting a bit extreme in one direction, helping you decide if now’s a good time to step in or take profits.
How to use Relative Strength Index (RSI) indicator
Think of the RSI as a “mood ring” for a stock: watch for it dipping below 30 and then bouncing back above that’s a hint the selling may be exhausted and could be a good time to buy and keep an eye on it rising above 70 and then slipping back below, which often signals buying is overdone and you might lock in gains. It also helps to see whether it’s above or below 50 to tell if bulls or bears are in charge, and you can scan for “divergences” (when price and RSI move opposite) as an early heads‑up that a trend could reverse.
How to read Relative Strength Index (RSI) indicator
Think of the RSI like a speedometer for price moves when it’s above 70, the stock’s been racing ahead and may need to slow down (overbought), and when it’s below 30, it’s been sliding hard and could be due for a rebound (oversold). Values around 50 show a balance between buyers and sellers, so if RSI stays above 50 you’re in a bullish mood, and below 50 you’re in a bearish one. You can also watch for price making new highs or lows that RSI doesn’t “confirm” (a divergence), which often hints the current trend might be running out of steam.
What is Relative Strength Index (RSI) level
An RSI level is simply the number you see on the Relative Strength Index scale (which runs from 0 to 100) that tells you how stretched a stock’s recent moves are readings above about 70 suggest the stock might be “overbought” (it’s been bid up too fast), readings below about 30 suggest it might be “oversold” (it’s fallen too hard), and levels around 50 mean buyers and sellers are roughly in balance.
Relative Strength Index (RSI) overbought
When RSI is “overbought,” it means the indicator has climbed into the upper zone typically above 70 signaling that buying pressure has been very strong and the stock may have run up too quickly; this doesn’t guarantee an immediate pullback, but it’s a warning that the rally could be tiring and it might be a good moment to lock in profits or tighten your stops.
Disclaimer: The information provided herein is for informational purposes only and does not constitute investment advice, a recommendation, or an offer to buy or sell any securities. All investment strategies and investments involve risk of loss. Individuals should conduct their own research or consult a financial advisor before making any investment decisions. The author/publisher is not a registered investment advisor and does not accept responsibility for any trading losses incurred based on the information provided. Past performance is not indicative of future results.